Showing posts with label visuals. Show all posts

5.10.2007

Can you visually represent the connections?


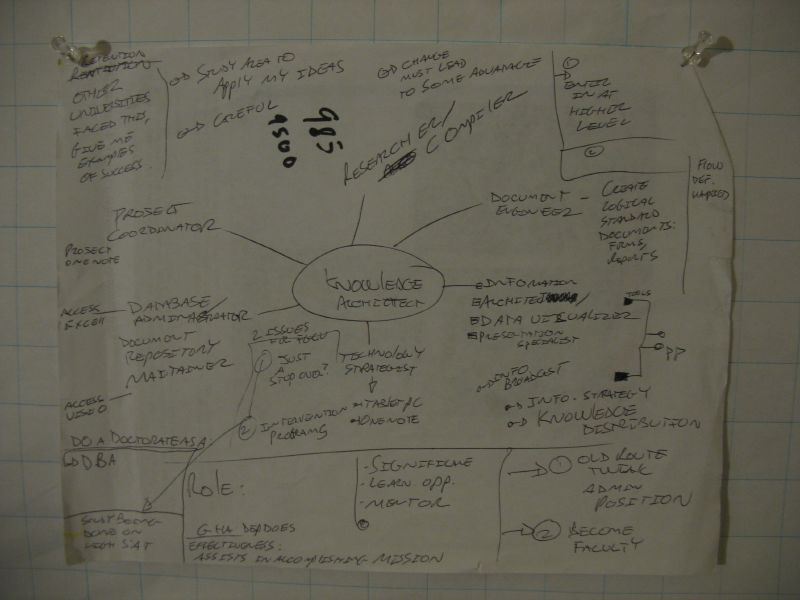
Content Analysis Day 1
Originally uploaded by mstephens7.

Can you visually represent the connections?
Yes, I take pics of the documents( that's a tametheweb.com pic by Michael Stephens) I create too; there are many reasons but in a way the pics capture some of the organic feel of information plus serve as a back-up copy, allow for sharing. Also, it's nice to know what came out of the research; visual representations of information/data often help with this. But, I'm a graphic novel fan and became a passionate reader because of comic books. So, I like the visuals.

5.07.2007

What do you think about “Task” orientated maps?


What do you think about "Task" orientated maps?


Like "To Print, Go here…"


http://ci.fsu.edu/go/userservices/students/student_printing


Shouldn't libraries help users not only find their way but accomplish their tasks?

5.05.2007

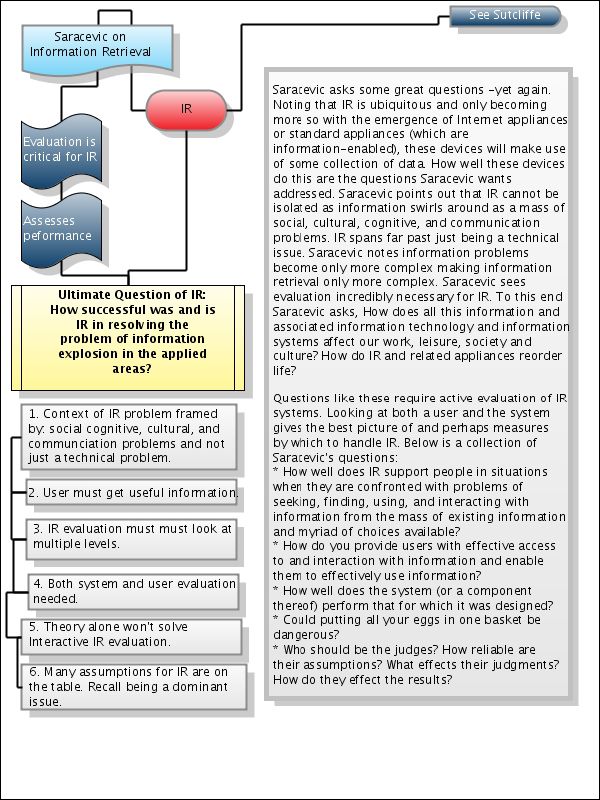
Why not create information visuals?


Why not create information visuals? The organization of information and the way of presentation should highlight matters for your consideration. Note-documents must highlight items another researcher may not deem significant. Even if the relevancy could be questionable, why could this be a way to present relevancy? Looking forward to another engaging chat after another long, but enjoyable, day of work, with my fellow information professionals. Creative tension makes one grow, but this doesn't mean you pull the rice.